U.S. Nuclear Plants Humming Along During June 2012 Heat Wave

Yesterday, the National Oceanic and Atmospheric Administration reported that the month of June experienced 170 all-time high temperature records being broken or tied throughout the country. They also reported that the first half of 2012 has been the warmest first half period on record back to 1895. As such, we wanted to share that most all of the U.S. nuclear plants were humming along at full power during June, helping provide electricity to air conditioners to keep all of us cool during these hot times.

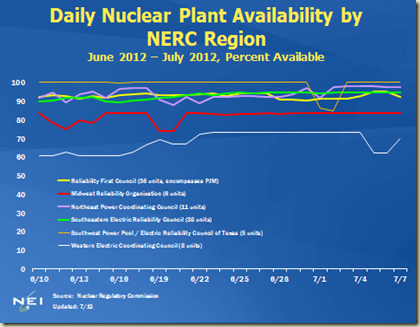
Below are three charts breaking out the daily availability data from the Nuclear Regulatory Commission which we aggregated based on the North American Electric Reliability Council they belong to. You can find the list of plants and their region on page 4 of this report.

image

The following chart shows a daily average of the 104 nuclear units. Overall, the U.S. fleet was running at a steady average availability of 90.5% during the last four weeks.

image

And the last chart shows the NERC regions, how many reactors belong to each region in the U.S., and their average availability.

image

It’s worth pointing out that two of the regions, MRO and WECC, had  a lower average availability factor of 82% and 68%, respectively. This was mainly because three of the 14 reactors in those regions have been in long-term shutdown.

Average availability in MRO is lower because Fort Calhoun is down (1 unit out of 6). If we take Fort Calhoun out of the calculation, the plants that are running in that region have an average availability of 98.2%.

Similarly in WECC, the two San Onofre units are down. If we take San Onofre out, the other six reactors in the region have an average availability of 90.3%.

And in SERC and FRCC, Crystal River (1 unit out of 38) has also been down. Take Crystal River out of the equation, and the plants running have an average availability of 95.5% (vs. 93.0% for all 38).

Performance of Other Technologies

There isn’t similar daily availability data for other technologies to compare their performances to nuclear during the same heat wave. But to give an idea of how they perform annually, below is a chart of average capacity factors for various power sources.

image

August is typically the summer month for peak nuclear generation. As the summer progresses, we’ll see nearly all nuclear units online by then.

Though this year’s trend isn’t looking promising, hopefully temps will be a bit cooler for everyone during the rest of the summer. Stay cool.
Comments

Pete51 said…
The third chart down is a little misleading, since there are several CANDU plants in the NPCC region, but only the US plants are reported.

Popular posts from this blog

An Ohio School Board Is Working to Save Nuclear Plants

Ohio faces a decision soon about its two nuclear reactors, Davis-Besse and Perry, and on Wednesday, neighbors of one of those plants issued a cry for help. The reactors’ problem is that the price of electricity they sell on the high-voltage grid is depressed, mostly because of a surplus of natural gas. And the reactors do not get any revenue for the other benefits they provide. Some of those benefits are regional – emissions-free electricity, reliability with months of fuel on-site, and diversity in case of problems or price spikes with gas or coal, state and federal payroll taxes, and national economic stimulus as the plants buy fuel, supplies and services. Some of the benefits are highly localized, including employment and property taxes. One locality is already feeling the pinch: Oak Harbor on Lake Erie, home to Davis-Besse. The town has a middle school in a building that is 106 years old, and an elementary school from the 1950s, and on May 2 was scheduled to have a referendu

Why Ex-Im Bank Board Nominations Will Turn the Page on a Dysfunctional Chapter in Washington

In our present era of political discord, could Washington agree to support an agency that creates thousands of American jobs by enabling U.S. companies of all sizes to compete in foreign markets? What if that agency generated nearly billions of dollars more in revenue than the cost of its operations and returned that money – $7 billion over the past two decades – to U.S. taxpayers? In fact, that agency, the Export-Import Bank of the United States (Ex-Im Bank), was reauthorized by a large majority of Congress in 2015. To be sure, the matter was not without controversy. A bipartisan House coalition resorted to a rarely-used parliamentary maneuver in order to force a vote. But when Congress voted, Ex-Im Bank won a supermajority in the House and a large majority in the Senate. For almost two years, however, Ex-Im Bank has been unable to function fully because a single Senate committee chairman prevented the confirmation of nominees to its Board of Directors. Without a quorum

NEI Praises Connecticut Action in Support of Nuclear Energy

Earlier this week, Connecticut Gov. Dannel P. Malloy signed SB-1501 into law, legislation that puts nuclear energy on an equal footing with other non-emitting sources of energy in the state’s electricity marketplace. “Gov. Malloy and the state legislature deserve praise for their decision to support Dominion’s Millstone Power Station and the 1,500 Connecticut residents who work there," said NEI President and CEO Maria Korsnick. "By opening the door to Millstone having equal access to auctions open to other non-emitting sources of electricity, the state will help preserve $1.5 billion in economic activity, grid resiliency and reliability, and clean air that all residents of the state can enjoy," Korsnick said. Millstone Power Station Korsnick continued, "Connecticut is the third state to re-balance its electricity marketplace, joining New York and Illinois, which took their own legislative paths to preserving nuclear power plants in 2016. Now attention should